
ArchiMate example views introduced here are organized into a layered framework according to ArchiMate standard (link). These example views illustrate how ArchiMate concepts can be used. Some of the examples can be used as design patterns.
For more ArchiMate examples in a structured way, check the ArchiMate Cookbook. (Also available as pdf link .)
Get a free ArchiMate modelling tool Archi: link. 

Check the ArchiMate User Community for more information: link
ArchiMate Examples
ArchiMate Example Views
Framework View
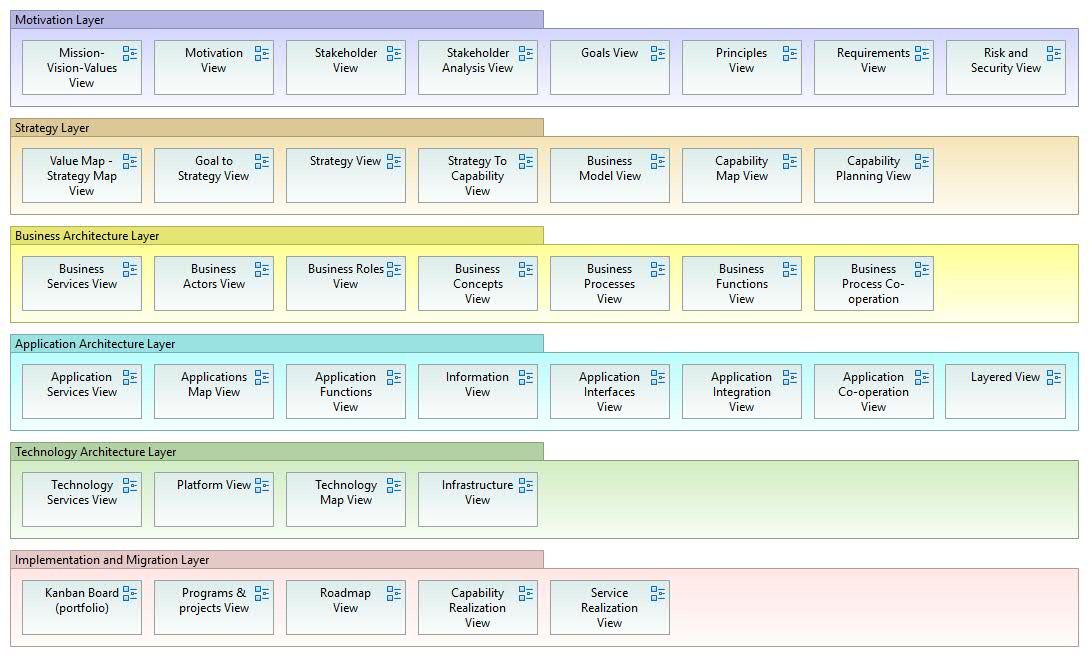
This view represents the framework that structures all the development aspects and related diagrams. The view can be modified according to what is appropriate in the case. As such, this view can be used for navigation between the diagrams. This version of the view is applied from ArchiMate (3) framework. Motivation is introduced as a “Layer” instead of an “Aspect” here.
Motivation Views
Motivation View

This view can be used to analysis of the motivations, or reasons, that guide the design or change of an organization and its enterprise architecture. These motivational analyses are the starting points for all the change activities or business transformations in an organization. This view represents the vision of the development endeavor – whether the scale and scope comprise the whole organization or just part of it (e.g. line of business) or a single program or project (solution level). Note: a value can be added e.g. to the outcome (or to any other ArchiMate element), to indicate what is the real value add!
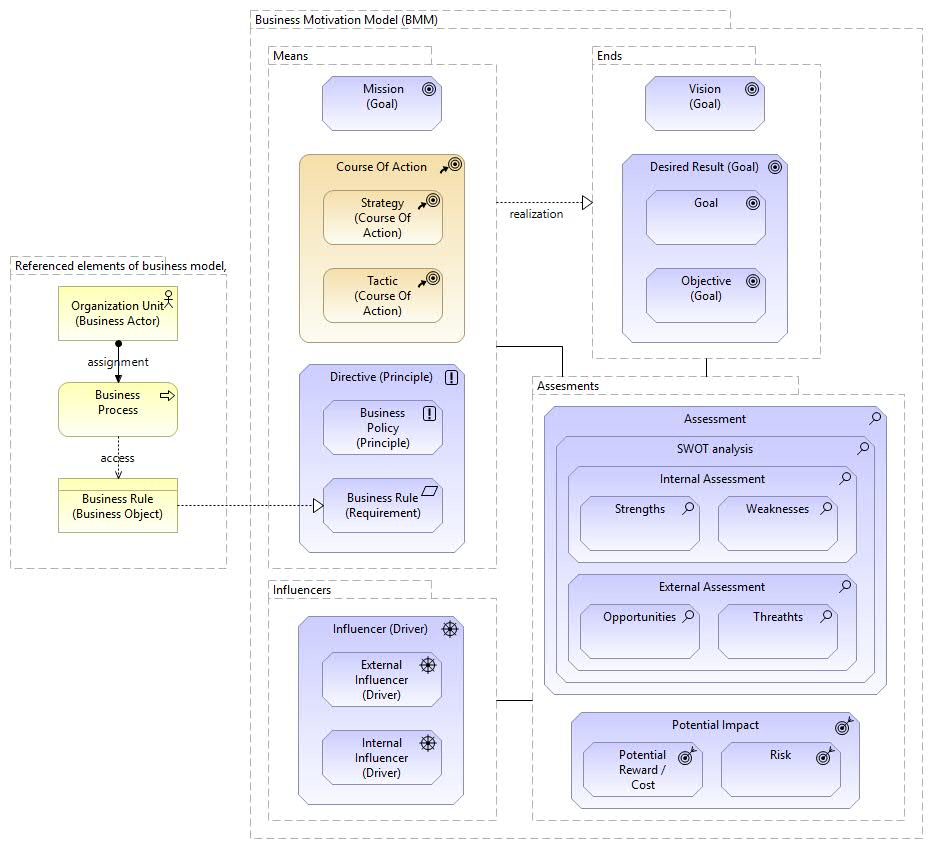
Motivational elements are based on Business Motivation Model (BMM) [specification v.1.3, 2015, OMG].
Mission-Values-Vision View
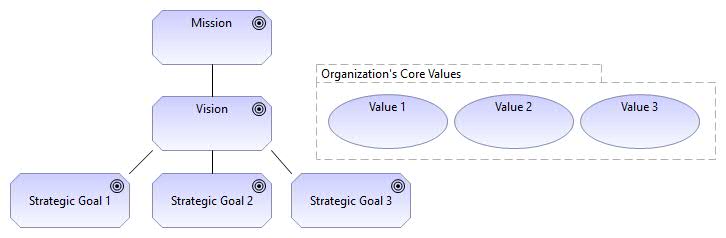
This view can be used to represent the organization’s mission, vision and core values. Mission expresses e.g. “What is the organization’s purpose, what is it actually doing or intents to do, what is the primary reason for its existence?” Vision is the future state towards which the organization intends to evolve. Core values are what support the vision, shape the culture, and reflect what the organization values. Strategic goals need to be accomplished in order to achieve the vision of the organization.
Reference: Aldea, A. – Iacob, M.-E. – Hillegersberg, J. – Quartel, D. – Franken, H. (2015) Modelling strategy with ArchiMate.
Strategic Value Map View

This view can be used for visualization of the strategies of the organization. This view contains strategic value-elements, from which all the development activities have to be derived – directly or indirectly. By visualizing the strategic values, it can be possible to trace all the other elements that are involved with the actual strategy execution. With this view, the strategy can be made available: visualized, communicated and linked to reality.
Stakeholder Analysis View

This view can be used for stakeholder analysis for business development purposes: what are the drivers for change. First, identify the relevant stakeholders and then the drivers for change that are in the interests of them. The “Assessment” concepts can be used for detailed analysis of drivers, e.g. according to SWOT (Strengths, Weaknesses, Opportunities, Threats) method. As typical, distinct stakeholder view diagrams can be created from different viewpoints. Another reason for splitting large diagrams into smaller ones is to keep the diagrams compact and readable – for the sake of simplicity.
Stakeholder View

This view can be used for linking stakeholder’s drivers to business goals. Goals are the key elements of development in an organization. All the subsequent elements should be traced back to these primary reasons for all the change activities.
Principles View

Risk & Security View

Risk and Security View.Mapping of Risk and Security Concepts to the ArchiMate. Security and data protection matters are part of risk management. This modelling approach covers them both.
References:
- How to Model Enterprise Risk Management and Security with the ArchiMate® Language, Open Group, DocumentNo: W172, 2017.
- Modeling Enterprise Risk Management and Security with the ArchiMate® Language, Open Group, 2015.
SWOT Analysis View

Goals View

Objectives and Key Results

An OKR is a popular management strategy that defines objectives and tracks results. It helps create alignment and engagement around measurable goals. OKRs have two important parts: The objective you want to achieve and the key results, which are the way you measure achieving the objective.
Objectives:
– are memorable, qualitative descriptions of what you want to achieve. Objectives should be short, inspirational, and engaging. An objective should motivate and challenge the team.
Key results:
– are a set of metrics that measure your progress towards the objective. For each objective, you should have a set of two to five key results. More than that and no one will remember them.
Another version with actions shown below.

Strategy Views
Strategy Layer Views
Strategy View

ArchiMate version 3 now supports business strategy-related concepts such as “Course of Action”, “Capability” and “Resource”, which can be used for modeling business strategies of the organization. The value and importance of this view is in the way that the goals of the organization can be linked to strategies, and how they can be linked into enterprise architecture via capabilities. This view can be used to apply the “Goal-Based Strategic Model” (Azevedo et al. 2015), in which goals constitute a hierarchy, so that higher-level goals can be decomposed into lower-level goals.
Business Strategy View

Business Motivation Model (BMM) View
Requirements View

This view can be used to gathering requirements based on the strategic goals. This is linking the strategies to implementations: it is possible to trace strategies to execution.
Strategy to Capability View

This view can be used for Capability-Based Planning (CBP) purposes, together with other ArchiMate concepts such as “Driver” and “Goal” as shown in the diagram below. This view can be used to support Strategy Planning (and -Execution) purposes. As such, this kind of view can be used in the Strategy-to-Capability phase, which can be included in the “Strategy-to-Portfolio” in IT4IT.
Capability Map View

This view can be used for giving an overview of an organization’s capabilities: what the organization does or can do.
The basic structure consists of three parts as follows:
- Business Management – these capabilities are needed for managing the business
- Operational Business – this contains operational capabilities that are needed for the organization to do its business
- Business Support – these capabilities are for enabling the business

Capability Map example.
For more details see Business Capability.
Capability Planning View

This view can be used for e.g. Capability-Based Planning (CBP) purposes, which is “the Link between Strategy and Enterprise Architecture”. This view can be used for e.g. mapping strategies to required capabilities, and mapping capabilities to resources and other building blocks.
Note! Capability is a behavioral unit of an organization, and capability is realized by resources.
See Capability-Based Development (CBD) for more details.
Capability Realization View

Capability Realization View 2
Another view of defining how by which elements a capability can be realized…

Capabilty And Resource Decomposition / Realization pattern
A capability is a behavioral element of an organization such as business service, business process, business function, application service, application process or -function.
A resource is a structural element of an organization such as a business actor, application, software or device.

Capability Decomposition
For simplicity and the sake of better understanding and easier communication, a capability can be composed also with resource elements as shown in the diagram below. (Note! All the relationships are realizations, as shown in the diagram above.)

This is aligned with the Milky Way Map -approach, in which capabilities are used as basic units of an organization.
Capabilities are the units of behavior at the highest level of organization development. As such, there can be information flows between the capabilities as shown in the capability cooperation view below. However, further analysis introduces the actual parties of the information switching: typically the information is transferred between the actors, processes and/or applications.
Another representation of business capability decomposition. This can be used as a template for modelling a business capability. This view represents the anatomy of a capability, and provides an easy Business Capability Canvas (BCC) template for modelling all the capabilities of an organization.

Capability Cooperation View

Capability Increments View
This view can be used for modelling the incremental development of a capability.

Capability Roadmap View
This view can be used for capability roadmapping purposes. When there are lots of changes to be developed to a capability, it would be valuable to illustrate which modifications to which elements are to be made. This helps overall program and/or project management.

Value Stream View

Note! A “directed association” used in the beginning of the Value Chain / Value Stream. A value stream can consist of value “stages” . Analogous to that, an overall, high-level value stream can be a “value chain”, which in turn, consists of value streams. For example, the IT4IT (link) introduces a value chain that consists of four value streams as follows: Strategy to Portfolio, Requirement to Deploy, Request to Fulfill, Detect to Correct (link).
Value Stream – Capability Cross Mapping View
Value Delivery Chain-simple example is shown below. Value Chains, Value Networks and Value Streams can be modelled with ArchiMate Value Stream -element, that included in the ArchiMate 3.1 version.

Value Delivery Chain. This is an extended example, which illustrates how capabilities support (serve) the value stream. This view can be used for defining WHAT the organization does (the Business Model), and WHY capabilities are needed, what is their linkage to the value creation.
This view is included in Lean EA Framework (LEAF) reference implementation (link). Navigate to “Value Streams”, “Value Delivery Chain”.
Business Model Canvas View

This is the basic form of the Business Model Canvas (BMC) by A. Osterwalder, but it can be variated according to what is appropriate. There are also versioned approaches such as “Service Model Canvas” or “Lean Canvas”. A BMC can be used e.g. for business model design and innovation.
Modeling a BMC with ArchiMate “facilitates tracing of requirements from business demands down to the design specifications. This helps to discover the effects of business model changes on architectural design.” [L.O. Meertens et al.]
Holistic development includes built-in architecture-support for strategy and business model analysis. This enables business analysts and developers to observe e.g. how well the business model supports the strategy and how the business model fits into the organization, and vice versa.
If the BMC is modeled within a modeling tool, an advantage of this approach is that all the elements of the BMC can be used in other views of the same model repository. And when pivoting the business model, all the changes are immediately visible. Business modelers can create new elements such as services, or utilize all the existing elements in the repository such as organization units or resources.
Concept Canvas View

Concept Canvas. There can different variations of the BMC, as illustrated below. The layout of this Concept Canvas is aligned with the layered approach of ArchiMate.
Business Views
Business Architecture Layer Views.
In each layer there are several “maps” of elements that are managed within the EA-tool, such as Business Services Map, Process Map etc. After identified and introduced maps, those elements may be used in other diagrams (such as layered views). The purpose of the maps is to manage catalogs of “EA assets” as “portfolios” (analogous to portfolios of ideas, services and projects etc.). EA-tools typically provide other features for each element, e.g. properties or attributes. Those can be used to provide additional information per each element. This kind of extra information can also be used in different kinds of analysis purposes.
There can be several maps on each layer e.g. as follows:
- In Business Layer: Business Services, Business Actors, Business Processes
- In Application Layer: Application Services, Applications
- In Technology Layer: Technology Services, Platforms, Technologies etc.
Some example business layer maps are introduced here.
Business Services Map View
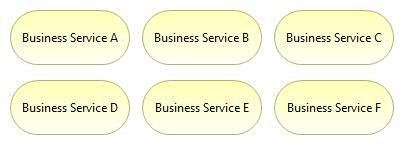
This view gives an overview of the business services of the organization. This kind of view can be used as “Service Catalog” or “Service Portfolio” for management purposes. It is important to identify what are the business services the organization is providing to its customers. In addition, a business service is a starting point for modelling all the underlying organizational processes and structures. As such, business services are the most important elements of the enterprise architecture.
Business Process Map View

This view can be used as “Process Map” which gives an overview of the business processes of the organization.
Business Process Co-Operation View

This view can be used e.g. for modelling the operating model.
Business Actors Map View

Business Actors can be a) internal or b) external. Internal business actors are e.g. organization units, and external business actors are e.g. customers, business partners, or other stakeholder groups that co-operate with the organization (such as public sector organizations or other governance authorities).
Business Actor Co-Operation View

Two usage-scenarios are as follows:
- Intra-Enterprise View: Business actor co-operation viewpoint, which depicts how internal business actors co-operate, how they switch information.
- Inter-Enterprise View: The Ecosystem viewpoint, which depicts the operational environment in which an organization operates. An ecosystem is a network of organizations and business partners, which are co-operating via interactions of collaborations. There are suppliers, sub-contractors and other b2b partners, customers etc.
Business Process View

This business process view provides a “high-level structure and composition of a business process (or several processes), the services that are offered, the assigned roles of actors, and the information used by the business process” [ArchiMate 2.1 specification]. This process diagram contains “Junction” -elements to model “fork” and “join” in the process flow.
An advanced process view shown below. This is the operating model that is based on the business model, which is illustrated in the value stream diagram above.

SIPOC (Suppliers, Inputs, Process, Outputs, Customers)

Six Sigma tool called SIPOC (Suppliers, Inputs, Process, Outputs, Customers) can be used for defining elements common to all processes. This is an easy tool for analyzing the business case: what is the value the customer gets and how.
Business Process View With Business Roles As “Swimlanes” of a Process – A Layered Approach

The “Business Role A” represents the customer, whereas the upmost “swimline” represents the customer journey path.
Note! Process steps (activities) are nested into business roles (visualized as “swimlanes”), which means that: these Business Roles are assigned to these Business Processes/process steps. As such, this view is a combination of business process view and layered view.
This version below illustrates the information & data flows (flow relationship). The upper “swimline” represents the customer journey path (activities connected with the triggering relationship).

This version below represents the service design approach. The topmost “swimline” (role A) represents the customer journey path, which is connected with the organization (roles B and C) via business services (1 and 2).

Layered Business Process View
This view can be used for modeling a business process that consists fo both manual and automatized steps.

Business Architecture Overview
This version of the layered view is an overview diagram that consists of business- and application layer concepts. Technology layer concepts can be added whenever appropriate. This overview can be used e.g. for conceptualizing the context of business change (business transformation) efforts. This example below illustrates the high-level overall Order-to-Cash -end2end process, which typically spans over several units such as Sales- or Production departments. In addition, the overall process utilizes a number of applications such as CRM- or ERP -systems.

Order to cash = a set of business processes that involve receiving and fulfilling customer requests for goods or services.
Customer Journey Map View
This version is created by using Motivation- and Strategy-elements, when a customer journey is to be analyzed at high-level.

This version is created by using Business- and Application layer (core) -elements, when the customer service path is to be analyzed in more detail.

This customer-centric viewpoint is focusing on customer experience. This “service design” related approach is concentrating the “outside-in” development of the service that is to be designed. This highlights the services and products as essential aspects that produce value to customers – and indirectly to the organization itself. A customer journey path can be used to the visualization of a customer value stream, which spans several application services and applications.
Service Blueprint View

This viewpoint is customer- and service-centric, but it emphasizes also the “inside-out” part of the service. With the help of this approach, the service-driven development can identify the underlying behavioral and structural impacts of the service that is to be designed. As such, this viewpoint complements the customer-experience driven approach with process- and functional aspects.
There are several variations of this view. This example above focuses on information flows between the layers and elements.
User Story View
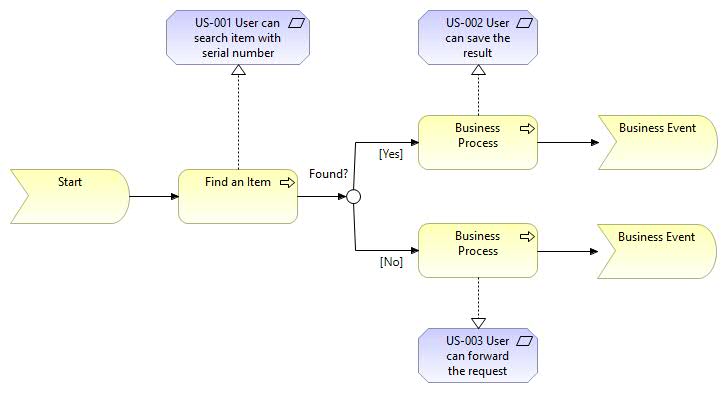
This view can be used to visualization of user stories.
Cloud-Service Models View

Information View
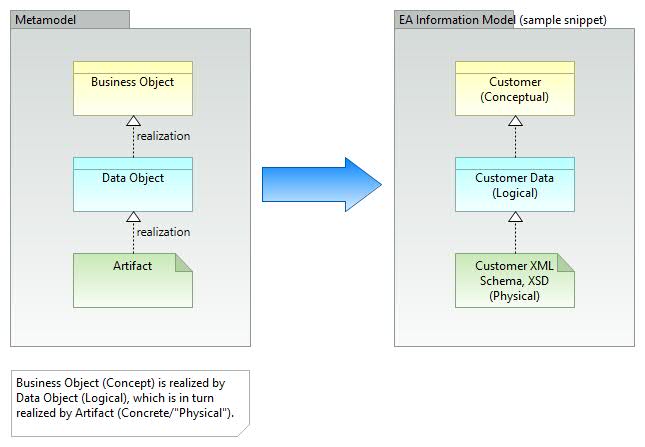
Information can be modelled on different abstraction levels as follows: a) conceptual, b) logical and c) physical levels. The diagram above illustrates these abstraction levels.
Conceptual Data Model View

Conceptual Data Model View.
Information architecture of the EA contains business objects a.k.a. concepts, that are used in business processes. These concepts and their relations can be represented in a conceptual data model.
“Service” Concept

Service Concept.
The service-concept is quite often problematic, as can be understood in many different ways. To make clear distinction which service type is in question, good practice is to mention the prefix: business-, application- or technology service. The IT Service is related to production service according to ITIL. As such. IT Service maps to the Application Services the most.
Service and Product

Product -concept can be used as a composite element for grouping services. According to ArchiMate -specification:
“A product represents a coherent collection of services and/or passive structure elements, accompanied by a contract/set of agreements, which is offered as a whole to (internal or external) customers.”
“A product may aggregate or compose business services, application services, and technology services, business objects, data objects, and technology objects, as well as a contract. Hence a product may aggregate or compose elements from other layers than the Business Layer. “
“A value may be associated with a product. The name of a product is usually the name which is used in the communication with customers, or possibly a more generic noun (e.g., “travel insurance”).”
Application Views
Application Architecture Layer Views.
Application Services Map View

Applications Map View

Application portfolio, in which applications can be divided into groups e.g. based on business units.
Application Co-Operation View (Data flows)

Application Integration View (Dynamic relationships)
Several alternative approaches of modeling data switching between applications are shown in the examples (1 to 10) below.
- “Application A” owns a data object “A-1”, which is requested by “Application B”.
- Data flows from “Application A” to “Application B”.
- “Application A” realizes a service “A-1” that is used by “Application B”.
- Practically, “Application B” requests the Application Interface “A-1” and gets response…

Application Structure View
This view is useful in designing or understanding the main structure of an application and its sub-components and the associated data. This diagram can be used e.g. to break down the structure of the application system under construction, to illustrate modularization / decomposition: what are the sub-systems / sub-components what are the application services (or application interfaces) they provide.

Note that application services (figure above) are the behavioral functionalities that are provided by the structural interfaces (GUIs and/or APIs in the figure below). Application Services and Application Interfaces are the “different sides of the same coin”.

Application Architecture View
This view mixes EA level and solution level approaches, as there are are both applications and application modules in the same view.

Application Component Model (CM)
Application Component Model 0-n is an application architecture modelling approach, which consists of diagrams of different abstraction levels as follows:.
- At CM-0 -level the diagram describes how the application interacts with its environment, what are the interactions with adjacent applications and users. The target application is depicted as a black-box.
- At CM-1 -level the target application is decomposed into modules (main components), and what application services (or application interfaces) those modules provide and require. The target application is depicted as a white-box.
- At CM-2 -level the modules are decomposed into sub-components. (Number of necessary levels depends to what is appropriate on the case)
The Application Component Model (CM) diagrams below consist of application components and application services. Alternatively, application interfaces can be used instead of application services depending on the case. As always, it is important to utilize such a modelling style what is appropriate for the purpose, and model only those elements that are informative enough and provide certain added value. It is up to modeller, whether he or she likes to emphasize the functional aspects, or to be more concrete, and model e.g. the actual interfaces with exact naming.
Component Model diagrams below consist of application components and application services. Alternatively, application interfaces can be used instead of application services.
Application Component Model – 0 (CM-0)

Component Model – 0 (CM-0) level (above) illustrates interactions between target application and adjacent applications. All the relevant application services (or application interfaces) are introduced. The 0-level the diagram consists of enterprise architecture level components and their services, target application is in the middle.
Application Component Model – 1 (CM-1)

Component Model – 1 (CM-1) level (above) illustrates how the target application is decomposed into modules (or main components), and which module realizes which application services (or application interfaces). Note! External applications can be left out from this level, but their services (or interfaces) are shown. When more low-level elements are shown, then more high-level elements can / have to be left out – for the sake of simplicity: to keep the diagram readable.
Application Component Model – 2 (CM-2)

Component Model – 2 (CM-2) level (above) illustrates how target application’s modules are composed from sub-components, and how they interact.
Application Functions View
Application functional decomposition: what are the functions the system contains, and which application services they provide?

Application Process View


Application Component Sequence Diagram View
Sequence diagrams are not exactly in scope of ArchiMate, but instead, those are in scope of UML. However, we can use ArchiMate for modelling sequences of actions taken by e.g. Application Components as shown below.

Dynamic relations “Trigger” and “Flow” can be used for modelling dynamics between application components. The layout of this view can be positioned analogously to the UML sequence diagram.
Application Component Sequence Diagram View 2
This version (diagram below) illustrates how ArchiMate can be used for modelling sequences of actions taken by internal parts of Application Components. The internal parts are such as a) behavioral processes or functions and b) structural sub-components. These are modelled with Application Process-, Application Function- and Application Component -elements. Those are shown here just as alternatives.

The flow of actions in this sequence diagram (above):
- The Application Component “A’s” sub-process “X” sends a request message with parameter “A” to the Application B.
- The Application Component “B’s” sub-process “B-1” receives the incoming request, and then calls (synchronously) Application Component C, in which Application Function “Y” receives the request, performs some actions and responds back.
- The Application Component “B’s” other sub-process “B-2” sends a message with parameters to the Application Component D, and receives acknowledgement. Application Component “D” contains sub-component that executes the processing.
- The Application Component “A” receives the response message from the Application Component B.
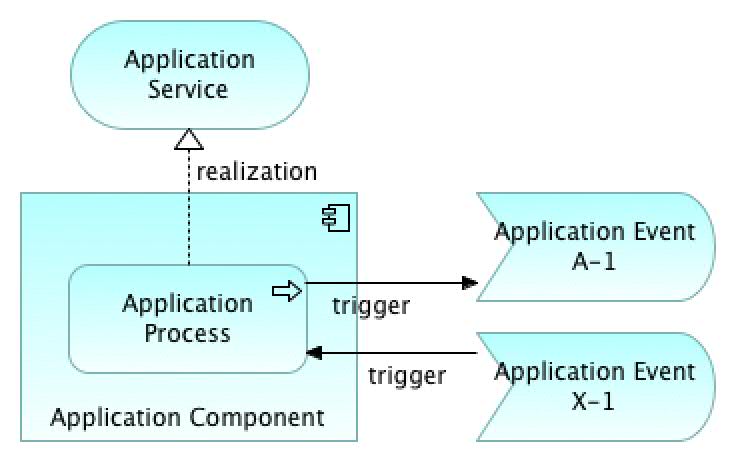
As shown here, we can model quite complex integration cases with combination of these elements (Application Component, Application Process and Application Function and relations (Trigger, Flow). UML sequence diagram has its own specialized purpose in software design, but ArchiMate can be utilized in quite a many modelling purposes – also in application design.
Application integration is one of the most important parts of the enterprise architecture (EA). That is why it is advantageous if we can model more detailed how applications switch data, and what are the interaction mechanisms used. A good source to dive into integration patterns, see “Enterprise Integration Patterns” -book, here is the link.
A sequence with the end-user added (figure below) follows the same idea of using ArchiMate dynamic relationships Trigger and Flow, which can be used for modelling both synchronous and asynchronous messaging patterns (request-response and callback, also publish-subscribe etc.).

ETL-process View

EAI / ESB View

Layered View
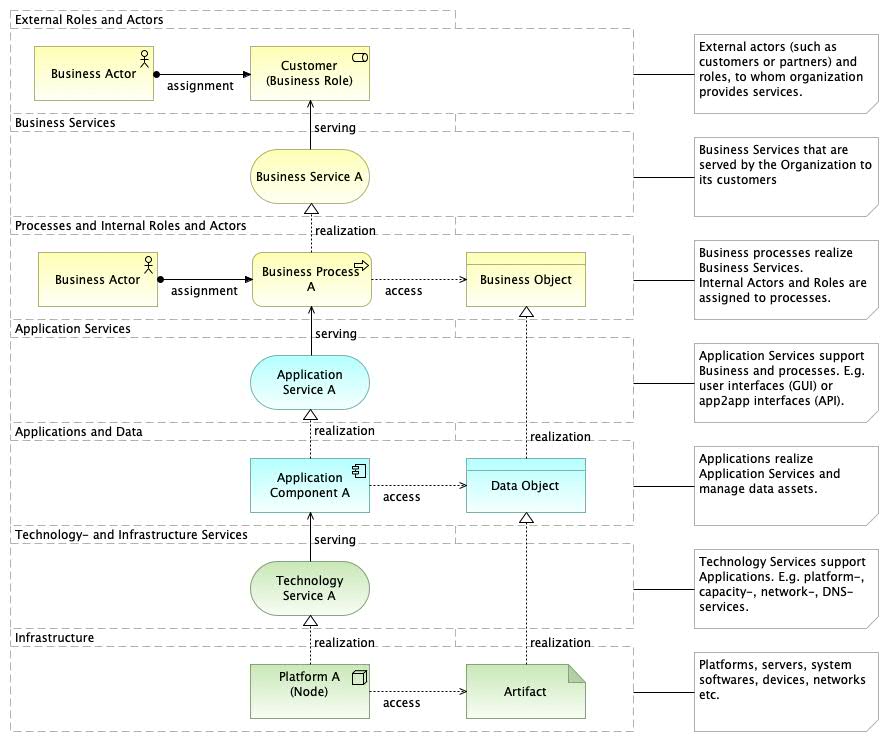
The Layered View can be used as an overview context diagram of a target area. The main advantage of this view is to illustrate the usage of applications in business processes and services they provide. The diagram above is using ArchiMate Grouping-element for modelling different layers, whereas the diagram below uses visual Group -element provided by the tool (Archi).
Basically there is three (3) layers in ArchiMate as follows: 1) Business Layer, 2) Application Layer and 3) Technology Layer. They are coloured typically as follows: Business Layer with yellow, Application Layer with turquoise and Technology Layer with green (see ArchiMate core framework, link).

Application & Database View
A database is a meaningful unit in the overall enterprise architecture of an organization. E.g. “Client database” or “Customer database”, “Product database” etc. Or, a database can be a logical (and physical) composition of all the tables of an application (e.g. “Customer table”, “Orders table”, “Invoices table” etc.), which all together build up a database. According to ArchiMate specification, a Data Object can be used for modelling a logical database (figure below), chapter 9.4.1 “Data Object” says: “Typical examples of data objects are a customer record, a client database, or an insurance claim.” “An important exception is when a data object is used to model a data collection such as a database, of which only one instance exists.”. ArchiMate has an elegant built-in mechanism, which enables to utilize certain concept for diverse abstraction levels (and levels of details). Hence, e.g. the Data Object can be used for modelling for example a logical database, a database table, message structure (switched between applications) etc.


Use Case View
ArchiMate can be used for analysing use cases from the functional perspective of an application. Use Cases (as known in UML) can be mapped to Application Services, as shown in the figure below.

A use case can be divided into following parts: a) business use case and b) system use cases (a.k.a. system cases). The figure below illustrates how a “main use case” can be modelled with the Business Service, and subsequent system cases as Application Services.

When the use cases are identified as application services, they can be further used in other diagrams (such as in the layered view) as elements of functionalities of the target application. In other words: application services represent the behavior (the functionalities) of an application. For more information concerning use case analysis, see the ArchiMate Cookbook, link.
Technology Views
Technology Architecture Layer Views.
Infrastructure View
This view represents a platform of an application. This pattern can be used to model a configuration of run-time environment, the deployment of the business application.


Implementation and Migration Layer / Transformation Architecture Layer Views
Implementation Roadmap View

Kanban View

Kanban board can be used for visualization of work and the workflow. Kanban board shows how e.g. development requirements, epics, user stories etc. are flowing from backlog to ready state (Done). Kanban board can be applied for diverse purposes depending on the scale and scope of the development case. E.g in EA level by using “Epics” or in project level by using “User Stories” or “Requirements” as work items. The granularity of work items can vary depending on the case.
Generic View

This kind of simplified view can be used e.g. as contextual diagram of specific service, program or project.
Extras
Context Overview – The Milky Way Map
This is an approach to visualize as much as possible in the same view. For more details see The Milky Way Map with ArchiMate.

Co-operation View
It is possible to mix the layers as shown in this data flow diagram example below.

Metamodel

These examples are created mainly with Archi tool (link). Some diagrams are created with Sparx EA (link), such as Value Stream examples. A reference Lean EA Framework, that is created with Sparx EA and published as html, can be found via this link.
See also the “ArchiMate Cookbook“: link.
I’ve been inspired by these sources:
- “Enterprise Architecture at Work” (4th edition), -book by Marc Lankhorst et al. (link)
- “Mastering ArchiMate” -book & blog (link) by Gerben Wierda
— Eero Hosiaisluoma